Jessica Hassan
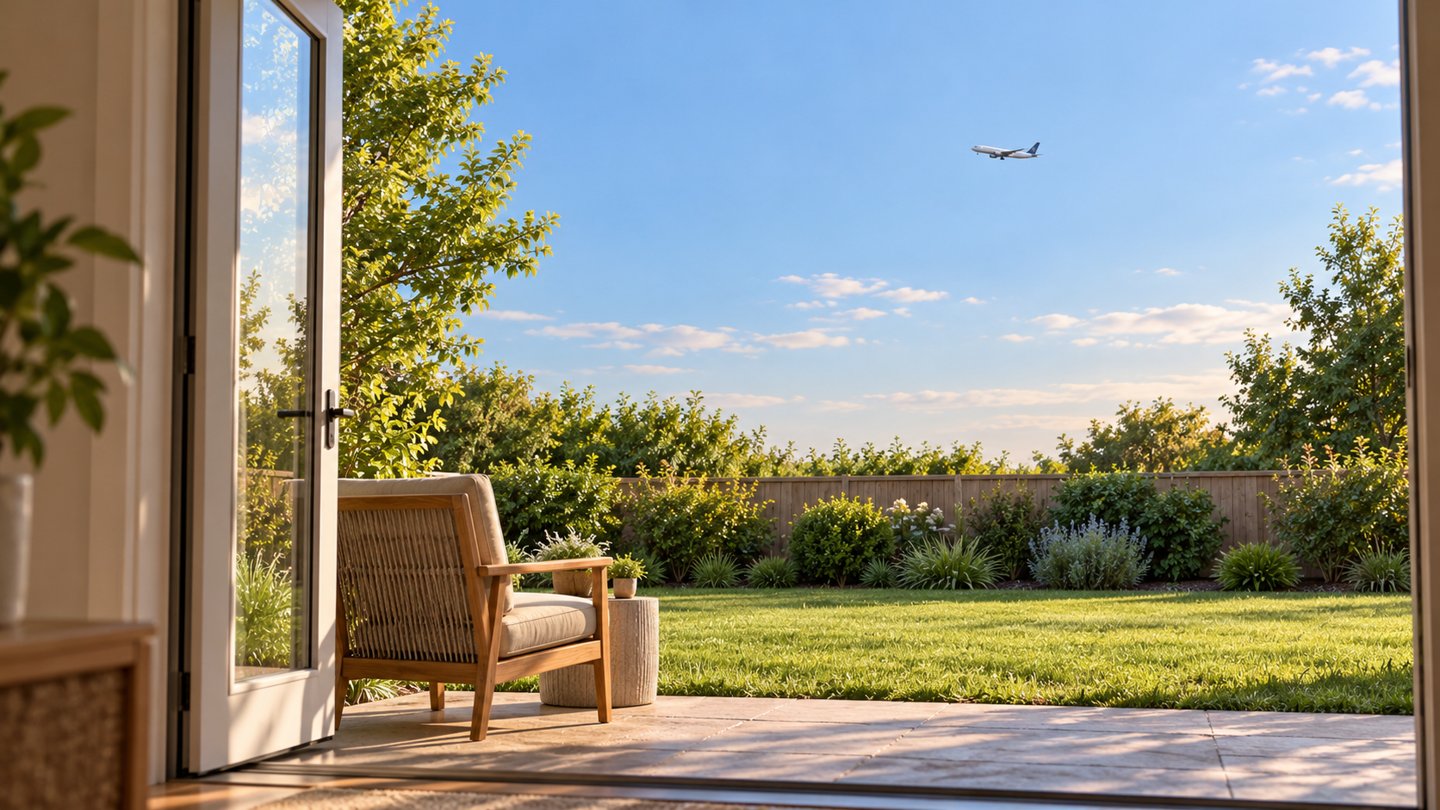
If you are comparing homes around Huntsville and Madison, airport noise deserves its own place in the decision—not a quick assumption based on distance from the terminal. An official map can help you understand a planning document. It cannot tell you whether a particular backyard, bedroom or work-from-home routine will feel comfortable to you.
The important local detail is easy to miss: the noise map currently linked by the Port of Huntsville is a historical document. Here is how to read it without turning an old contour into a present-day promise about a home.
Read the map’s date before its lines
The Port’s Master Plan & Reports page links a Noise Map under Environmental Documentation. Open that one-page airport noise map and look at the lower-right title block: Exhibit 4-3, dated February 1990, depicts a 1993 scenario involving passenger and all-cargo hubbing. The land-use source note cites October 1988 aerial photography and January 1989 field verification. Those are different dates serving different purposes—not evidence collected in 2026.
The separate Part 150 final report linked on the same page has a June 1991 cover date. A current website hosting a document does not make the underlying study current. Neither document should be used here to label a present-day listing “inside today’s noise contour” or “quiet.”
On the map, colored areas identify land uses; the lines labeled Ldn 65, 70 and 75 are noise contours. The heavy airport boundary is another feature again. Read the legend rather than treating every colored area as a noise rating. The old road and land-use background is not a current parcel survey.
DNL is an average exposure measure, not the loudest plane
FAA’s noise fundamentals guide explains that day-night average sound level (DNL) represents cumulative exposure for an average day of the year, using annual aircraft operations. The airport map’s Ldn notation refers to the same metric, as the FAA’s DNL definition explains. A contour joins locations with the same modeled value. It does not mean sound stays at that level all day. A brief, louder flight and a longer or more frequent pattern can contribute differently to an average; different patterns can produce the same DNL.
For a single passing aircraft, the peak level is a different measure, Lmax. That distinction matters when your concern is an interrupted conversation rather than annual exposure. A contour cannot supply the peak sound in your bedroom or tell you how often you would pause a call.
FAA’s community-noise explanation describes a 10-decibel weighting for nighttime events between 10 p.m. and 7 a.m. In the calculation, an otherwise equivalent nighttime event carries ten times the weight of a daytime event. That is a mathematical adjustment for timing—not a claim that an aircraft physically becomes ten times louder at night.
FAA uses 65 DNL as a significant-exposure threshold in its published guidance. Being below that planning threshold is not a promise of silence or a personal comfort rating. Aircraft type, operation, flight path, schedule and weather all affect the experience on the ground. Distance alone is not a reliable substitute.
Do not confuse a city airport zone with a measured noise contour
Huntsville’s official FAA Zones GIS layer includes an Airport Noise Exposure Zone alongside approach, horizontal and other airport-related zones. Its published fields identify the zone type and geometry; they do not provide a DNL value or a noise-study year. The layer name is not enough to turn its boundary into a current acoustic result.
For a property-specific land-use question, take the parcel and proposed use to the planning authority that actually governs that property. For an acoustic question, request the relevant dated noise study. These are different questions even when both resources use the word “airport.” This guide makes no zoning or buildability determination for any parcel.
| Evidence | Useful for | Not enough to establish |
|---|---|---|
| Historical airport contour map | Reading the named scenario, contour labels and land-use legend | Today’s parcel-level noise exposure |
| City FAA Zones layer | Identifying a mapped zone for further planning research | A current DNL value or an indoor sound level |
| Your visit to the home | Observing sound during that visit, in the rooms and outdoor spaces you would use | An annual average or the full range of future conditions |
Compare two homes without giving either a false noise score
Imagine two listings: one appears outside a line on the historical map, while the other is simply described as farther from the airport. Neither fact settles the choice. Keep both on the same comparison sheet until you have better evidence; do not give the first a “quiet” checkmark or automatically reject the second.
For each home, record the map or study title and date separately from your observations. During an authorized showing, spend time in the bedroom, the space you would use for calls, and the yard or patio. Note the visit time, whether windows were open or closed, what you heard and whether it interrupted an activity that matters to you. If sound is a deciding factor, arrange another visit at a relevant time rather than treating one quiet interval as representative.
This is a personal comparison, not a calibrated noise survey. If you need an acoustic measurement or an assessment of sound reduction through the building, use a qualified acoustical professional and ask what period and conditions the assessment covers. Do not assume a window upgrade will deliver a particular result from a listing description alone.
Keep the other daily tradeoffs visible too. My Huntsville-area commute guide explains how to compare actual home-to-work routes rather than distance circles. If you are flying in to make these comparisons, the HSV arrival and ground-transport guide can help you leave enough room in the visit for a second look.
Ask for the missing evidence by name
Use the Port of Huntsville contact page to ask which noise exposure map and operating assumptions it recommends for a current property inquiry. Include the parcel or location privately and identify the February 1990 map so there is no confusion about the document you already have. Request the study year and whether a map describes existing conditions or a future scenario. This research did not establish a newer current contour for individual homes.
For an actual aircraft-noise concern, FAA’s noise inquiry guidance provides an airport-contact lookup and an escalation route through its Noise Portal and regional ombudsman. It directs military-aircraft questions to the installation’s noise office or community-relations department. Do not assume every sound heard in Greater Huntsville came from HSV.
Final Thoughts
Use the historical map to understand the document, the appropriate planning authority to resolve land-use questions, and property visits or professional assessment to investigate the experience you care about. When comparing Huntsville and Madison homes, keep sound, commute and the way you use the house on the same shortlist. A dated source and a clear observation are more useful than a confident but unsupported “quiet neighborhood” label.
Want Personalized Real Estate Help?
If you are buying or relocating around Huntsville and Madison, I can help you organize a shortlist around your daily routine and the property questions that need better answers. Contact me to talk through your priorities before you narrow the search.
You can also explore homes in the broader Huntsville and Madison area as a starting point. This geographic search does not filter for noise exposure, flight paths or quiet interiors; evaluate each property separately.
Sharing is Caring:
Author

Sources and review notes
Sources reviewed October 30, 2026. The airport map and report are historical; the FAA explanatory pages were last updated in 2022, and its inquiry page in February 2026. Featured image: AI-generated fictional illustration, not a local property, flight-path depiction or evidence of sound levels.