Stevenson – Jackson County
Demographics for Stevenson
A snapshot of key demographic indicators for Stevenson, including age distribution, gender balance, and racial composition. Stevenson is designated by the US Census Bureau as a city. It is located in Jackson County, Alabama. Covering a land area of 7.69 square miles and water area of 0.41 square miles. The details in this section relate to demographics-based data scoring and metrics for Stevenson to assist with real estate decisions in your research.
Margin of Error: +/- 532
Margin of Error: +/- 6.2
Margin of Error: +/- 5.1%
Margin of Error: +/- 8.7%
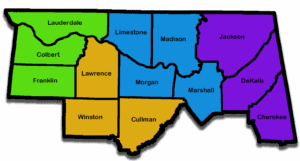
Map for Stevenson
Overall Score for Stevenson
This section presents comparative amenity scores for Stevenson, highlighting how this locality ranks across key categories such as safety, health services, transportation, and more—relative to other communities throughout the Northern Alabama region. These scores are designed to offer objective, data-driven insights into amenity density and distribution. They do not indicate whether a location is inherently “good” or “bad,” but instead support informed decision-making by showing how various places compare across measurable factors.
Average Score Across All Components
What is the Total Overall Score and how is it calculated?
The Overall Concentration Score is based on the combined average Concentration Scores across amenity types for a locality. It is intended to quantify the density of all points of interest near a given location by assigning greater weight to amenities closer to the location. It balances quantity, proximity, and community access, helping convey how accessible overall amenities are within the immediate community fabric.
The Overall Concentration Score uses proximity bands of amenity types weighted by distance influence:
- ≤1 mi → weight 20.0
- ≤3 mi → weight 10.0
- ≤5 mi → weight 5.0
- ≤10 mi → weight 3.0
- ≤20 mi → weight 1.0
The weighted totals for all measured amenity types are then averaged to calculate the Overall Concentration Score based on the 20-mile band maximum.
Safety Section Details
>Health Section Details
Transportation Section Details
Commuting Section Details
Attractions Section Details
Convenience Section Details
Dining Section Details
Leisure Section Details
Worship Section Details
Outdoors Section Details
Safety Services near Stevenson
Stevenson is ranked #46t for Safety Services and ranked #108 for Safety Services per capita in our curated list of Northern Alabama localities. There are a total of 4 Safety Services places, with 0 Safety Services within 5 miles of it’s geographical center, ranking Stevenson at #20t overall on our list for 1 to 5 mile accessibility. The details in this section relate to Safety Services-based, proximity-weighted scoring and metrics for Safety Services presence within 20 miles of Stevenson to assist with real estate decisions based on Safety Services being priorities in your research.
within 20 miles
within 5 miles
Regional unweighted ranking for Safety Services places within 5 miles.
Ranked regional localities in this region
Safety Services place density <20 miles (1256.64 square miles)
Stevenson is ranked #5t overall for Safety Services in Jackson County.
normalized to 20-mile max
What is the Safety Services calculated score and how are they calculated?
Safety Services Concentration Score is based on FCI and quantifies the density of Safety Services near a given location by assigning greater weight to closer Safety Servicess sites. It balances quantity, proximity, and community access, helping convey how rooted Safety Services is in the immediate community fabric.
The Safety Services Concentration Index uses proximity bands of Safety Services weighted by distance influence:
- ≤1 mi → weight 20.0
- ≤3 mi → weight 10.0
- ≤5 mi → weight 5.0
- ≤10 mi → weight 3.0
- ≤20 mi → weight 1.0
The weighted totals are then used to calculate the Safety Services Concentration Score based on the 20-mile band maximum.
πr² area method
Highest place density appears within the ≤1 mi mile range.
ACS population: 1947
Up to 20 miles
Moe
What’s in the placeholder?
Placeholder Information
Placeholder Note
How was the information for this section on Safety Services obtained?
📌 Methodology & Sources – Safety Services Density Analysis for Stevenson
The data presented in this section was developed through a multi-source geospatial analysis of Stevenson for Safety Services places and demographic patterns within Alabama.
Safety Services were identified and geocoded using OpenStreetMap (OSM) and the Overpass API, filtered specifically for nodes tagged with
amenity=Safety Services. Additional enrichment was performed using data overlays from:
- U.S. Census Bureau TIGER/Line Shapefiles – for administrative and statistical boundaries
- American Community Survey (ACS) 2023 5-Year Estimates – for population counts, land area (
ALAND), and demographic attributes - Locality and tract-level identifiers – derived from Census GEOIDs and tract centroids for spatial anchoring
Spatial clustering and density metrics were calculated for Stevenson using a centroid-based radial distance model across multiple bands (e.g., 1, 5, 10, 20 miles). Population-adjusted ratios such as Safety Services per 1,000 residents and per square mile were derived by interpolating ACS tract-level population and land area figures within each band. These radial bands can be seen on the map view for Stevenson.
Regional rankings and weighted influence scores were developed by comparing all localities within predefined geographic groupings (e.g., counties Jackson, planning regions Northern Alabama, or metro statistical areas Appalachian Foothills Area), allowing for relative comparison of amenity footprint.
⚠️ Note: Due to the nature of volunteered geographic information (VGI) such as OSM, completeness of place listings may vary by locality. Where no results were returned locally, backup queries against regional Overpass bounding boxes were used to improve coverage. All Overpass queries included rate-limiting strategies to comply with usage policies.
This analysis is intended to provide an educational and informative overview of Stevenson related to Safety Services presence, density, and cultural imprint across the region. It should be interpreted as a best-effort representation based on available data sources and geospatial estimation techniques.
Health Medical near Stevenson
Stevenson is ranked #87t for Health Medical and ranked #162 for Health Medical per capita in our curated list of Northern Alabama localities. There are a total of 8 Health Medical places, with 4 Health Medical within 5 miles of it’s geographical center, ranking Stevenson at #40t overall on our list for 1 to 5 mile accessibility. The details in this section relate to Health Medical-based, proximity-weighted scoring and metrics for Health Medical presence within 20 miles of Stevenson to assist with real estate decisions based on Health Medical being priorities in your research.
within 20 miles
within 5 miles
Regional unweighted ranking for Health Medical places within 5 miles.
Ranked regional localities in this region
Health Medical place density <20 miles (1256.64 square miles)
Stevenson is ranked #11t overall for Health Medical in Jackson County.
normalized to 20-mile max
What is the Health Medical calculated score and how are they calculated?
Health Medical Concentration Score is based on FCI and quantifies the density of Health Medical near a given location by assigning greater weight to closer Health Medicals sites. It balances quantity, proximity, and community access, helping convey how rooted Health Medical is in the immediate community fabric.
The Health Medical Concentration Index uses proximity bands of Health Medical weighted by distance influence:
- ≤1 mi → weight 20.0
- ≤3 mi → weight 10.0
- ≤5 mi → weight 5.0
- ≤10 mi → weight 3.0
- ≤20 mi → weight 1.0
The weighted totals are then used to calculate the Health Medical Concentration Score based on the 20-mile band maximum.
πr² area method
Highest place density appears within the ≤3 mi mile range.
ACS population: 1947
Up to 20 miles
Moe
What’s in the placeholder?
Placeholder Information
Placeholder Note
How was the information for this section on Health Medical obtained?
📌 Methodology & Sources – Health Medical Density Analysis for Stevenson
The data presented in this section was developed through a multi-source geospatial analysis of Stevenson for Health Medical places and demographic patterns within Alabama.
Health Medical were identified and geocoded using OpenStreetMap (OSM) and the Overpass API, filtered specifically for nodes tagged with
amenity=Health Medical. Additional enrichment was performed using data overlays from:
- U.S. Census Bureau TIGER/Line Shapefiles – for administrative and statistical boundaries
- American Community Survey (ACS) 2023 5-Year Estimates – for population counts, land area (
ALAND), and demographic attributes - Locality and tract-level identifiers – derived from Census GEOIDs and tract centroids for spatial anchoring
Spatial clustering and density metrics were calculated for Stevenson using a centroid-based radial distance model across multiple bands (e.g., 1, 5, 10, 20 miles). Population-adjusted ratios such as Health Medical per 1,000 residents and per square mile were derived by interpolating ACS tract-level population and land area figures within each band. These radial bands can be seen on the map view for Stevenson.
Regional rankings and weighted influence scores were developed by comparing all localities within predefined geographic groupings (e.g., counties Jackson, planning regions Northern Alabama, or metro statistical areas Appalachian Foothills Area), allowing for relative comparison of amenity footprint.
⚠️ Note: Due to the nature of volunteered geographic information (VGI) such as OSM, completeness of place listings may vary by locality. Where no results were returned locally, backup queries against regional Overpass bounding boxes were used to improve coverage. All Overpass queries included rate-limiting strategies to comply with usage policies.
This analysis is intended to provide an educational and informative overview of Stevenson related to Health Medical presence, density, and cultural imprint across the region. It should be interpreted as a best-effort representation based on available data sources and geospatial estimation techniques.
Transportation near Stevenson
Stevenson is ranked #78t for Transportation and ranked #118 for Transportation per capita in our curated list of Northern Alabama localities. There are a total of 3 Transportation places, with 0 Transportation within 5 miles of it’s geographical center, ranking Stevenson at #28t overall on our list for 1 to 5 mile accessibility. The details in this section relate to Transportation-based, proximity-weighted scoring and metrics for Transportation presence within 20 miles of Stevenson to assist with real estate decisions based on Transportation being priorities in your research.
within 20 miles
within 5 miles
Regional unweighted ranking for Transportation places within 5 miles.
Ranked regional localities in this region
Transportation place density <20 miles (1256.64 square miles)
Stevenson is ranked #8t overall for Transportation in Jackson County.
normalized to 20-mile max
What is the Transportation calculated score and how are they calculated?
Transportation Concentration Score is based on FCI and quantifies the density of Transportation near a given location by assigning greater weight to closer Transportations sites. It balances quantity, proximity, and community access, helping convey how rooted Transportation is in the immediate community fabric.
The Transportation Concentration Index uses proximity bands of Transportation weighted by distance influence:
- ≤1 mi → weight 20.0
- ≤3 mi → weight 10.0
- ≤5 mi → weight 5.0
- ≤10 mi → weight 3.0
- ≤20 mi → weight 1.0
The weighted totals are then used to calculate the Transportation Concentration Score based on the 20-mile band maximum.
πr² area method
Highest place density appears within the ≤1 mi mile range.
ACS population: 1947
Up to 20 miles
Moe
What’s in the placeholder?
Placeholder Information
Placeholder Note
How was the information for this section on Transportation obtained?
📌 Methodology & Sources – Transportation Density Analysis for Stevenson
The data presented in this section was developed through a multi-source geospatial analysis of Stevenson for Transportation places and demographic patterns within Alabama.
Transportation were identified and geocoded using OpenStreetMap (OSM) and the Overpass API, filtered specifically for nodes tagged with
amenity=Transportation. Additional enrichment was performed using data overlays from:
- U.S. Census Bureau TIGER/Line Shapefiles – for administrative and statistical boundaries
- American Community Survey (ACS) 2023 5-Year Estimates – for population counts, land area (
ALAND), and demographic attributes - Locality and tract-level identifiers – derived from Census GEOIDs and tract centroids for spatial anchoring
Spatial clustering and density metrics were calculated for Stevenson using a centroid-based radial distance model across multiple bands (e.g., 1, 5, 10, 20 miles). Population-adjusted ratios such as Transportation per 1,000 residents and per square mile were derived by interpolating ACS tract-level population and land area figures within each band. These radial bands can be seen on the map view for Stevenson.
Regional rankings and weighted influence scores were developed by comparing all localities within predefined geographic groupings (e.g., counties Jackson, planning regions Northern Alabama, or metro statistical areas Appalachian Foothills Area), allowing for relative comparison of amenity footprint.
⚠️ Note: Due to the nature of volunteered geographic information (VGI) such as OSM, completeness of place listings may vary by locality. Where no results were returned locally, backup queries against regional Overpass bounding boxes were used to improve coverage. All Overpass queries included rate-limiting strategies to comply with usage policies.
This analysis is intended to provide an educational and informative overview of Stevenson related to Transportation presence, density, and cultural imprint across the region. It should be interpreted as a best-effort representation based on available data sources and geospatial estimation techniques.
Commuting near Stevenson
Stevenson is ranked #134t for Commuting and ranked #239 for Commuting per capita in our curated list of Northern Alabama localities. There are a total of 15 Commuting places, with 0 Commuting within 5 miles of it’s geographical center, ranking Stevenson at #98t overall on our list for 1 to 5 mile accessibility. The details in this section relate to Commuting-based, proximity-weighted scoring and metrics for Commuting presence within 20 miles of Stevenson to assist with real estate decisions based on Commuting being priorities in your research.
within 20 miles
within 5 miles
Regional unweighted ranking for Commuting places within 5 miles.
Ranked regional localities in this region
Commuting place density <20 miles (1256.64 square miles)
Stevenson is ranked #4t overall for Commuting in Jackson County.
normalized to 20-mile max
What is the Commuting calculated score and how are they calculated?
Commuting Concentration Score is based on FCI and quantifies the density of Commuting near a given location by assigning greater weight to closer Commutings sites. It balances quantity, proximity, and community access, helping convey how rooted Commuting is in the immediate community fabric.
The Commuting Concentration Index uses proximity bands of Commuting weighted by distance influence:
- ≤1 mi → weight 20.0
- ≤3 mi → weight 10.0
- ≤5 mi → weight 5.0
- ≤10 mi → weight 3.0
- ≤20 mi → weight 1.0
The weighted totals are then used to calculate the Commuting Concentration Score based on the 20-mile band maximum.
πr² area method
Highest place density appears within the ≤20 mi mile range.
ACS population: 1947
Up to 20 miles
Moe
What’s in the placeholder?
Placeholder Information
Placeholder Note
How was the information for this section on Commuting obtained?
📌 Methodology & Sources – Commuting Density Analysis for Stevenson
The data presented in this section was developed through a multi-source geospatial analysis of Stevenson for Commuting places and demographic patterns within Alabama.
Commuting were identified and geocoded using OpenStreetMap (OSM) and the Overpass API, filtered specifically for nodes tagged with
amenity=Commuting. Additional enrichment was performed using data overlays from:
- U.S. Census Bureau TIGER/Line Shapefiles – for administrative and statistical boundaries
- American Community Survey (ACS) 2023 5-Year Estimates – for population counts, land area (
ALAND), and demographic attributes - Locality and tract-level identifiers – derived from Census GEOIDs and tract centroids for spatial anchoring
Spatial clustering and density metrics were calculated for Stevenson using a centroid-based radial distance model across multiple bands (e.g., 1, 5, 10, 20 miles). Population-adjusted ratios such as Commuting per 1,000 residents and per square mile were derived by interpolating ACS tract-level population and land area figures within each band. These radial bands can be seen on the map view for Stevenson.
Regional rankings and weighted influence scores were developed by comparing all localities within predefined geographic groupings (e.g., counties Jackson, planning regions Northern Alabama, or metro statistical areas Appalachian Foothills Area), allowing for relative comparison of amenity footprint.
⚠️ Note: Due to the nature of volunteered geographic information (VGI) such as OSM, completeness of place listings may vary by locality. Where no results were returned locally, backup queries against regional Overpass bounding boxes were used to improve coverage. All Overpass queries included rate-limiting strategies to comply with usage policies.
This analysis is intended to provide an educational and informative overview of Stevenson related to Commuting presence, density, and cultural imprint across the region. It should be interpreted as a best-effort representation based on available data sources and geospatial estimation techniques.
Attractions near Stevenson
Stevenson is ranked #286 for Attractions and ranked #114 for Attractions per capita in our curated list of Northern Alabama localities. There are a total of 65 Attractions places, with 10 Attractions within 5 miles of it’s geographical center, ranking Stevenson at #171t overall on our list for 1 to 5 mile accessibility. The details in this section relate to Attractions-based, proximity-weighted scoring and metrics for Attractions presence within 20 miles of Stevenson to assist with real estate decisions based on Attractions being priorities in your research.
within 20 miles
within 5 miles
Regional unweighted ranking for Attractions places within 5 miles.
Ranked regional localities in this region
Attractions place density <20 miles (1256.64 square miles)
Stevenson is ranked #14t overall for Attractions in Jackson County.
normalized to 20-mile max
What is the Attractions calculated score and how are they calculated?
Attractions Concentration Score is based on FCI and quantifies the density of Attractions near a given location by assigning greater weight to closer Attractionss sites. It balances quantity, proximity, and community access, helping convey how rooted Attractions is in the immediate community fabric.
The Attractions Concentration Index uses proximity bands of Attractions weighted by distance influence:
- ≤1 mi → weight 20.0
- ≤3 mi → weight 10.0
- ≤5 mi → weight 5.0
- ≤10 mi → weight 3.0
- ≤20 mi → weight 1.0
The weighted totals are then used to calculate the Attractions Concentration Score based on the 20-mile band maximum.
πr² area method
Highest place density appears within the ≤1 mi mile range.
ACS population: 1947
Up to 20 miles
Moe
What’s in the placeholder?
Placeholder Information
Placeholder Note
How was the information for this section on Attractions obtained?
📌 Methodology & Sources – Attractions Density Analysis for Stevenson
The data presented in this section was developed through a multi-source geospatial analysis of Stevenson for Attractions places and demographic patterns within Alabama.
Attractions were identified and geocoded using OpenStreetMap (OSM) and the Overpass API, filtered specifically for nodes tagged with
amenity=Attractions. Additional enrichment was performed using data overlays from:
- U.S. Census Bureau TIGER/Line Shapefiles – for administrative and statistical boundaries
- American Community Survey (ACS) 2023 5-Year Estimates – for population counts, land area (
ALAND), and demographic attributes - Locality and tract-level identifiers – derived from Census GEOIDs and tract centroids for spatial anchoring
Spatial clustering and density metrics were calculated for Stevenson using a centroid-based radial distance model across multiple bands (e.g., 1, 5, 10, 20 miles). Population-adjusted ratios such as Attractions per 1,000 residents and per square mile were derived by interpolating ACS tract-level population and land area figures within each band. These radial bands can be seen on the map view for Stevenson.
Regional rankings and weighted influence scores were developed by comparing all localities within predefined geographic groupings (e.g., counties Jackson, planning regions Northern Alabama, or metro statistical areas Appalachian Foothills Area), allowing for relative comparison of amenity footprint.
⚠️ Note: Due to the nature of volunteered geographic information (VGI) such as OSM, completeness of place listings may vary by locality. Where no results were returned locally, backup queries against regional Overpass bounding boxes were used to improve coverage. All Overpass queries included rate-limiting strategies to comply with usage policies.
This analysis is intended to provide an educational and informative overview of Stevenson related to Attractions presence, density, and cultural imprint across the region. It should be interpreted as a best-effort representation based on available data sources and geospatial estimation techniques.
Convenience near Stevenson
Stevenson is ranked #89t for Convenience and ranked #56 for Convenience per capita in our curated list of Northern Alabama localities. There are a total of 4 Convenience places, with 2 Convenience within 5 miles of it’s geographical center, ranking Stevenson at #59t overall on our list for 1 to 5 mile accessibility. The details in this section relate to Convenience-based, proximity-weighted scoring and metrics for Convenience presence within 20 miles of Stevenson to assist with real estate decisions based on Convenience being priorities in your research.
within 20 miles
within 5 miles
Regional unweighted ranking for Convenience places within 5 miles.
Ranked regional localities in this region
Convenience place density <20 miles (1256.64 square miles)
Stevenson is ranked #11t overall for Convenience in Jackson County.
normalized to 20-mile max
What is the Convenience calculated score and how are they calculated?
Convenience Concentration Score is based on FCI and quantifies the density of Convenience near a given location by assigning greater weight to closer Conveniences sites. It balances quantity, proximity, and community access, helping convey how rooted Convenience is in the immediate community fabric.
The Convenience Concentration Index uses proximity bands of Convenience weighted by distance influence:
- ≤1 mi → weight 20.0
- ≤3 mi → weight 10.0
- ≤5 mi → weight 5.0
- ≤10 mi → weight 3.0
- ≤20 mi → weight 1.0
The weighted totals are then used to calculate the Convenience Concentration Score based on the 20-mile band maximum.
πr² area method
Highest place density appears within the ≤3 mi mile range.
ACS population: 1947
Up to 20 miles
Moe
What’s in the placeholder?
Placeholder Information
Placeholder Note
How was the information for this section on Convenience obtained?
📌 Methodology & Sources – Convenience Density Analysis for Stevenson
The data presented in this section was developed through a multi-source geospatial analysis of Stevenson for Convenience places and demographic patterns within Alabama.
Convenience were identified and geocoded using OpenStreetMap (OSM) and the Overpass API, filtered specifically for nodes tagged with
amenity=Convenience. Additional enrichment was performed using data overlays from:
- U.S. Census Bureau TIGER/Line Shapefiles – for administrative and statistical boundaries
- American Community Survey (ACS) 2023 5-Year Estimates – for population counts, land area (
ALAND), and demographic attributes - Locality and tract-level identifiers – derived from Census GEOIDs and tract centroids for spatial anchoring
Spatial clustering and density metrics were calculated for Stevenson using a centroid-based radial distance model across multiple bands (e.g., 1, 5, 10, 20 miles). Population-adjusted ratios such as Convenience per 1,000 residents and per square mile were derived by interpolating ACS tract-level population and land area figures within each band. These radial bands can be seen on the map view for Stevenson.
Regional rankings and weighted influence scores were developed by comparing all localities within predefined geographic groupings (e.g., counties Jackson, planning regions Northern Alabama, or metro statistical areas Appalachian Foothills Area), allowing for relative comparison of amenity footprint.
⚠️ Note: Due to the nature of volunteered geographic information (VGI) such as OSM, completeness of place listings may vary by locality. Where no results were returned locally, backup queries against regional Overpass bounding boxes were used to improve coverage. All Overpass queries included rate-limiting strategies to comply with usage policies.
This analysis is intended to provide an educational and informative overview of Stevenson related to Convenience presence, density, and cultural imprint across the region. It should be interpreted as a best-effort representation based on available data sources and geospatial estimation techniques.
Dining near Stevenson
Stevenson is ranked #82t for Dining and ranked #147 for Dining per capita in our curated list of Northern Alabama localities. There are a total of 10 Dining places, with 6 Dining within 5 miles of it’s geographical center, ranking Stevenson at #51t overall on our list for 1 to 5 mile accessibility. The details in this section relate to Dining-based, proximity-weighted scoring and metrics for Dining presence within 20 miles of Stevenson to assist with real estate decisions based on Dining being priorities in your research.
within 20 miles
within 5 miles
Regional unweighted ranking for Dining places within 5 miles.
Ranked regional localities in this region
Dining place density <20 miles (1256.64 square miles)
Stevenson is ranked #15t overall for Dining in Jackson County.
normalized to 20-mile max
What is the Dining calculated score and how are they calculated?
Dining Concentration Score is based on FCI and quantifies the density of Dining near a given location by assigning greater weight to closer Dinings sites. It balances quantity, proximity, and community access, helping convey how rooted Dining is in the immediate community fabric.
The Dining Concentration Index uses proximity bands of Dining weighted by distance influence:
- ≤1 mi → weight 20.0
- ≤3 mi → weight 10.0
- ≤5 mi → weight 5.0
- ≤10 mi → weight 3.0
- ≤20 mi → weight 1.0
The weighted totals are then used to calculate the Dining Concentration Score based on the 20-mile band maximum.
πr² area method
Highest place density appears within the ≤3 mi mile range.
ACS population: 1947
Up to 20 miles
Moe
What’s in the placeholder?
Placeholder Information
Placeholder Note
How was the information for this section on Dining obtained?
📌 Methodology & Sources – Dining Density Analysis for Stevenson
The data presented in this section was developed through a multi-source geospatial analysis of Stevenson for Dining places and demographic patterns within Alabama.
Dining were identified and geocoded using OpenStreetMap (OSM) and the Overpass API, filtered specifically for nodes tagged with
amenity=Dining. Additional enrichment was performed using data overlays from:
- U.S. Census Bureau TIGER/Line Shapefiles – for administrative and statistical boundaries
- American Community Survey (ACS) 2023 5-Year Estimates – for population counts, land area (
ALAND), and demographic attributes - Locality and tract-level identifiers – derived from Census GEOIDs and tract centroids for spatial anchoring
Spatial clustering and density metrics were calculated for Stevenson using a centroid-based radial distance model across multiple bands (e.g., 1, 5, 10, 20 miles). Population-adjusted ratios such as Dining per 1,000 residents and per square mile were derived by interpolating ACS tract-level population and land area figures within each band. These radial bands can be seen on the map view for Stevenson.
Regional rankings and weighted influence scores were developed by comparing all localities within predefined geographic groupings (e.g., counties Jackson, planning regions Northern Alabama, or metro statistical areas Appalachian Foothills Area), allowing for relative comparison of amenity footprint.
⚠️ Note: Due to the nature of volunteered geographic information (VGI) such as OSM, completeness of place listings may vary by locality. Where no results were returned locally, backup queries against regional Overpass bounding boxes were used to improve coverage. All Overpass queries included rate-limiting strategies to comply with usage policies.
This analysis is intended to provide an educational and informative overview of Stevenson related to Dining presence, density, and cultural imprint across the region. It should be interpreted as a best-effort representation based on available data sources and geospatial estimation techniques.
Leisure near Stevenson
Stevenson is ranked #256t for Leisure and ranked #149 for Leisure per capita in our curated list of Northern Alabama localities. There are a total of 61 Leisure places, with 9 Leisure within 5 miles of it’s geographical center, ranking Stevenson at #145t overall on our list for 1 to 5 mile accessibility. The details in this section relate to Leisure-based, proximity-weighted scoring and metrics for Leisure presence within 20 miles of Stevenson to assist with real estate decisions based on Leisure being priorities in your research.
within 20 miles
within 5 miles
Regional unweighted ranking for Leisure places within 5 miles.
Ranked regional localities in this region
Leisure place density <20 miles (1256.64 square miles)
Stevenson is ranked #14 overall for Leisure in Jackson County.
normalized to 20-mile max
What is the Leisure calculated score and how are they calculated?
Leisure Concentration Score is based on FCI and quantifies the density of Leisure near a given location by assigning greater weight to closer Leisures sites. It balances quantity, proximity, and community access, helping convey how rooted Leisure is in the immediate community fabric.
The Leisure Concentration Index uses proximity bands of Leisure weighted by distance influence:
- ≤1 mi → weight 20.0
- ≤3 mi → weight 10.0
- ≤5 mi → weight 5.0
- ≤10 mi → weight 3.0
- ≤20 mi → weight 1.0
The weighted totals are then used to calculate the Leisure Concentration Score based on the 20-mile band maximum.
πr² area method
Highest place density appears within the ≤1 mi mile range.
ACS population: 1947
Up to 20 miles
Moe
What’s in the placeholder?
Placeholder Information
Placeholder Note
How was the information for this section on Leisure obtained?
📌 Methodology & Sources – Leisure Density Analysis for Stevenson
The data presented in this section was developed through a multi-source geospatial analysis of Stevenson for Leisure places and demographic patterns within Alabama.
Leisure were identified and geocoded using OpenStreetMap (OSM) and the Overpass API, filtered specifically for nodes tagged with
amenity=Leisure. Additional enrichment was performed using data overlays from:
- U.S. Census Bureau TIGER/Line Shapefiles – for administrative and statistical boundaries
- American Community Survey (ACS) 2023 5-Year Estimates – for population counts, land area (
ALAND), and demographic attributes - Locality and tract-level identifiers – derived from Census GEOIDs and tract centroids for spatial anchoring
Spatial clustering and density metrics were calculated for Stevenson using a centroid-based radial distance model across multiple bands (e.g., 1, 5, 10, 20 miles). Population-adjusted ratios such as Leisure per 1,000 residents and per square mile were derived by interpolating ACS tract-level population and land area figures within each band. These radial bands can be seen on the map view for Stevenson.
Regional rankings and weighted influence scores were developed by comparing all localities within predefined geographic groupings (e.g., counties Jackson, planning regions Northern Alabama, or metro statistical areas Appalachian Foothills Area), allowing for relative comparison of amenity footprint.
⚠️ Note: Due to the nature of volunteered geographic information (VGI) such as OSM, completeness of place listings may vary by locality. Where no results were returned locally, backup queries against regional Overpass bounding boxes were used to improve coverage. All Overpass queries included rate-limiting strategies to comply with usage policies.
This analysis is intended to provide an educational and informative overview of Stevenson related to Leisure presence, density, and cultural imprint across the region. It should be interpreted as a best-effort representation based on available data sources and geospatial estimation techniques.
Places Of Worship near Stevenson
Stevenson is ranked #228 for Places Of Worship and ranked #305 for Places Of Worship per capita in our curated list of Northern Alabama localities. There are a total of 675 Places Of Worship places, with 71 Places Of Worship within 5 miles of it’s geographical center, ranking Stevenson at #85t overall on our list for 1 to 5 mile accessibility. The details in this section relate to Places Of Worship-based, proximity-weighted scoring and metrics for Places Of Worship presence within 20 miles of Stevenson to assist with real estate decisions based on Places Of Worship being priorities in your research.
within 20 miles
within 5 miles
Regional unweighted ranking for Places Of Worship places within 5 miles.
Ranked regional localities in this region
Places Of Worship place density <20 miles (1256.64 square miles)
Stevenson is ranked #16 overall for Places Of Worship in Jackson County.
normalized to 20-mile max
What is the Places Of Worship calculated score and how are they calculated?
Places Of Worship Concentration Score is based on FCI and quantifies the density of Places Of Worship near a given location by assigning greater weight to closer Places Of Worships sites. It balances quantity, proximity, and community access, helping convey how rooted Places Of Worship is in the immediate community fabric.
The Places Of Worship Concentration Index uses proximity bands of Places Of Worship weighted by distance influence:
- ≤1 mi → weight 20.0
- ≤3 mi → weight 10.0
- ≤5 mi → weight 5.0
- ≤10 mi → weight 3.0
- ≤20 mi → weight 1.0
The weighted totals are then used to calculate the Places Of Worship Concentration Score based on the 20-mile band maximum.
πr² area method
Highest place density appears within the ≤3 mi mile range.
ACS population: 1947
Up to 20 miles
Moe
What’s in the placeholder?
Placeholder Information
Placeholder Note
How was the information for this section on Places Of Worship obtained?
📌 Methodology & Sources – Places Of Worship Density Analysis for Stevenson
The data presented in this section was developed through a multi-source geospatial analysis of Stevenson for Places Of Worship places and demographic patterns within Alabama.
Places Of Worship were identified and geocoded using OpenStreetMap (OSM) and the Overpass API, filtered specifically for nodes tagged with
amenity=Places Of Worship. Additional enrichment was performed using data overlays from:
- U.S. Census Bureau TIGER/Line Shapefiles – for administrative and statistical boundaries
- American Community Survey (ACS) 2023 5-Year Estimates – for population counts, land area (
ALAND), and demographic attributes - Locality and tract-level identifiers – derived from Census GEOIDs and tract centroids for spatial anchoring
Spatial clustering and density metrics were calculated for Stevenson using a centroid-based radial distance model across multiple bands (e.g., 1, 5, 10, 20 miles). Population-adjusted ratios such as Places Of Worship per 1,000 residents and per square mile were derived by interpolating ACS tract-level population and land area figures within each band. These radial bands can be seen on the map view for Stevenson.
Regional rankings and weighted influence scores were developed by comparing all localities within predefined geographic groupings (e.g., counties Jackson, planning regions Northern Alabama, or metro statistical areas Appalachian Foothills Area), allowing for relative comparison of amenity footprint.
⚠️ Note: Due to the nature of volunteered geographic information (VGI) such as OSM, completeness of place listings may vary by locality. Where no results were returned locally, backup queries against regional Overpass bounding boxes were used to improve coverage. All Overpass queries included rate-limiting strategies to comply with usage policies.
This analysis is intended to provide an educational and informative overview of Stevenson related to Places Of Worship presence, density, and cultural imprint across the region. It should be interpreted as a best-effort representation based on available data sources and geospatial estimation techniques.